Journeys: Discover what's making your users convert or drop off
Note
The complexity of modern digital experiences can make it difficult for teams managing those experiences to get a comprehensive view of what users are actually doing in the product. Amplitude’s Journeys feature helps you overcome this challenge and develop a true understanding of how your users convert—or fail to convert—between key transitions within a 60-day conversion timeframe.
With Journeys, you can:
- See step-by-step breakdowns of all paths taken by converted and dropped-off users between two funnel steps in a single chart
- Uncover the paths most likely to accelerate conversion
- Identify what your users do instead of converting
- Identify the experiences that lead to conversion fastest, and those that take the longest to get there
- Understand the friction points in your customer experience, and develop a strategy to fix them
Who should use Journeys?
Journeys will deliver the most value to Amplitude users who want to understand how conversions happen in their product, and for those who know user friction exists but don’t know what’s actually causing it.
A Journeys use case
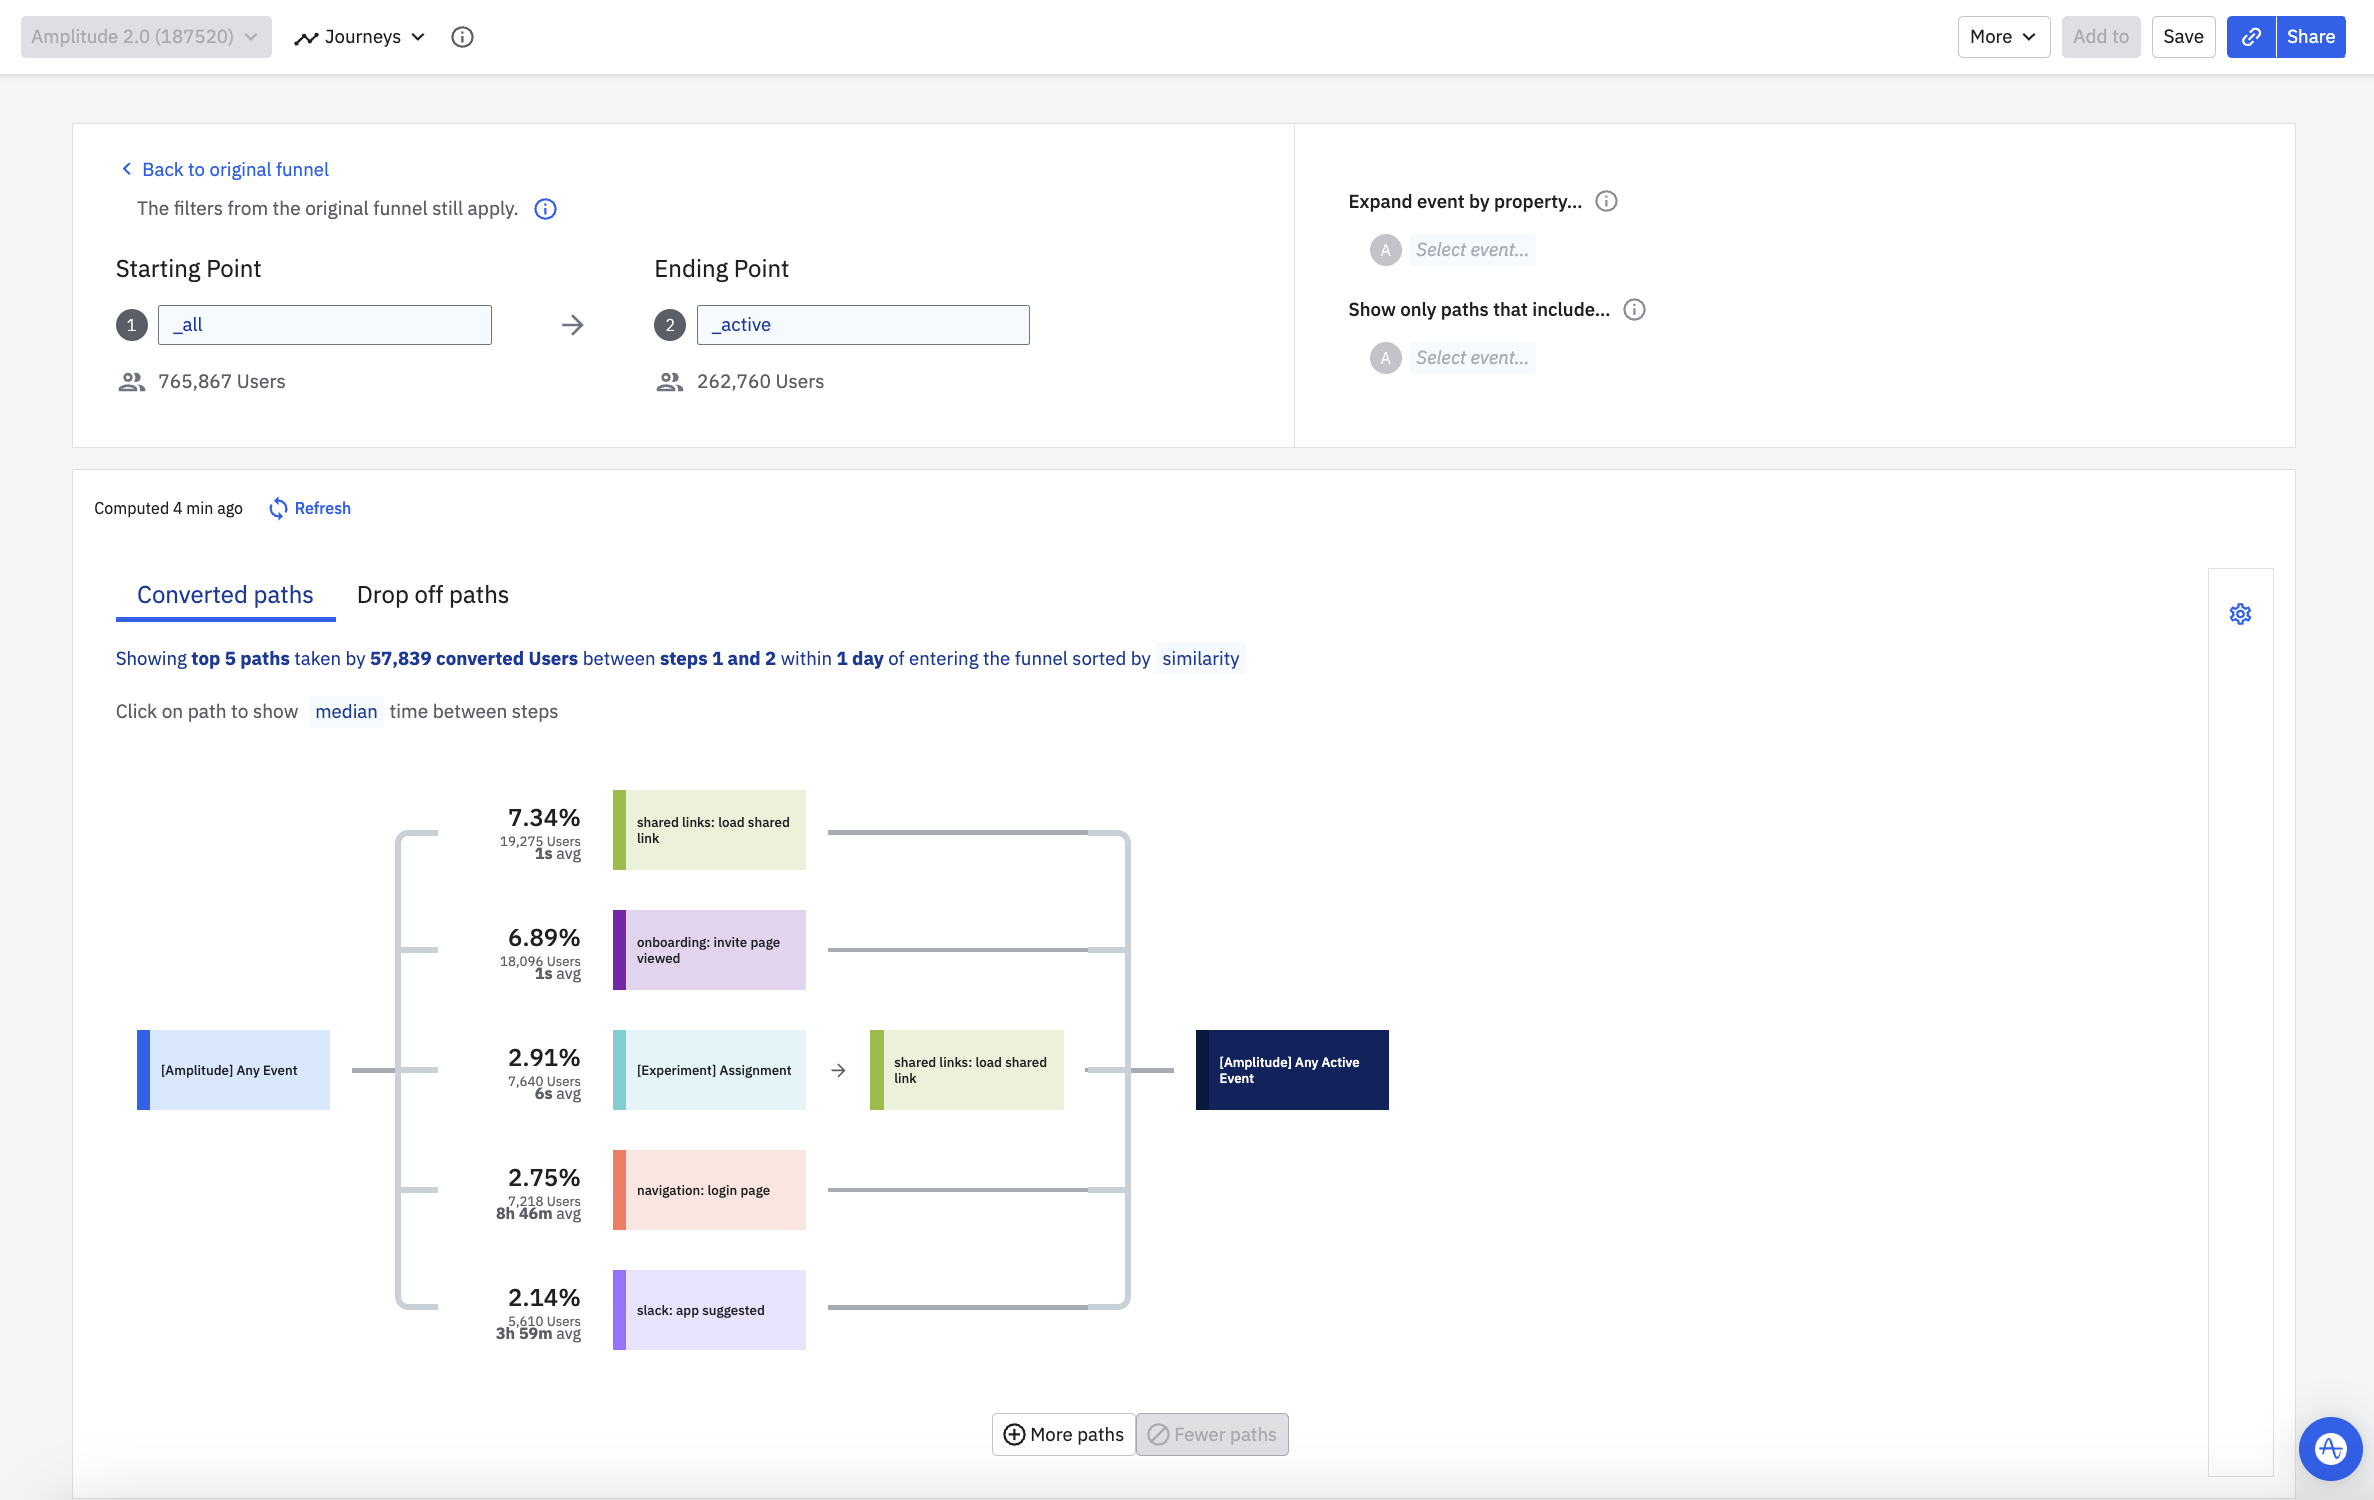
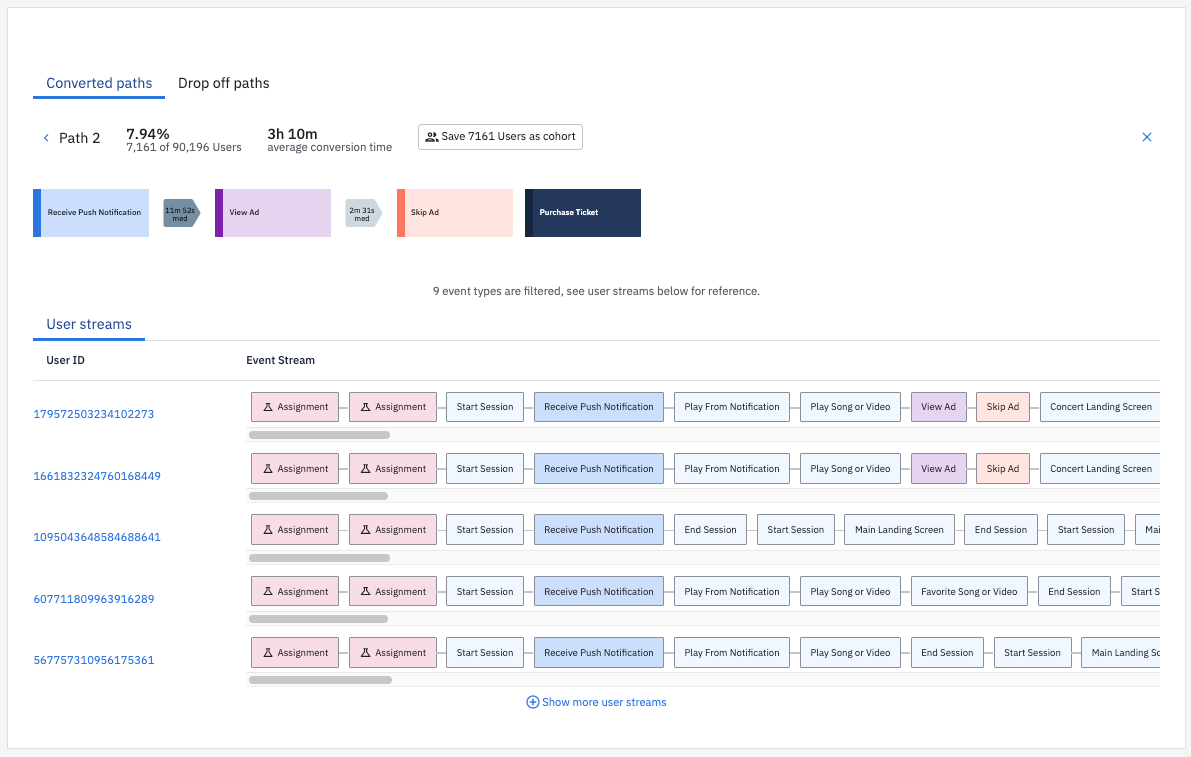
Let’s say a product manager wants to better understand the initial activation flow taken by her product’s users. She sets up a funnel analysis in Amplitude with a starting and ending event, and then opens Journeys. Here she finds an interesting path she wasn’t expecting, so she clicks on it to dig deeper. Journeys shows her the average time it takes a user to convert, as well as specific paths taken by individual users.
From here, she might develop a hypothesis about why users are behaving in a way that has implications for the design of the flow itself, which she can take to the product team for discussion and iteration. She might spot something in the flow that looks like it’s causing friction for users, which then leads to further questions and new explorations. Or she notices a large number of users are dropping off before getting to a critical step in the conversion process, so she saves them into a cohort, which she shares with the marketing team to target with specific messaging.
Journeys does the hard work of surfacing these patterns for you; all you have to do is follow the insights and keep asking follow-up questions.
View user conversion paths with Journeys
To see the details of your users’ conversion paths with Journeys, follow these steps:
- Create a funnel analysis with one starting and one ending event. For the event order, be sure to select “in this order.”
Note
2. In the chart, click the ending event to bring up the Microscope. From there, click Show User Journeys. The Journeys chart will appear.

3. By default, Amplitude displays user paths that resulted in conversions. If you're interested in viewing user paths that result in drop-offs instead, click Drop off paths.
4. Next, you can optionally adjust your auto-filter settings to ensure the view Journeys provides is at the level of granularity you need:
- Click the gear icon to open the auto-filter panel.
- Use the slider to adjust how aggressively the auto-filter weeds out unimportant events. Journeys’ auto-filter uses the TF-IDF heuristic to algorithmically remove noisy events from the analysis. Amplitude sorts events based on how likely they are to appear in user streams; the slider position determines what percentage of the events are excluded from the analysis. As you drag the slider towards Signal, the filter will remove more of the obvious events, and only show those that are less likely to appear in users’ timelines.
- If the auto-filter isn’t getting it quite right, you can also add specific events to always exclude or to always include in the custom overrides boxes.
- Click Hide to close the auto-filter panel and return to the chart.
Note
- In the chart, you should now see several distinct event paths bridging the starting and ending events. This is where your analysis should begin.
Note
To view the details of a specific path, or to save the users who have taken a particular path as a cohort to be used in later analysis or for targeting, just click the path.

You also have the option to handle specific events differently. Click the ![]() icon in the lower-right corner of the event if you want to:
icon in the lower-right corner of the event if you want to:
- Remove it from your analysis
- Expand the event by properties—this counts each event with a different property value as a different event, and Amplitude will reload all the paths based on this new set of events
- Only include certain property values in your analysis
Journeys vs Pathfinder: when to use each
Experienced Amplitude users might see some similarities between Journeys and Pathfinder. The two features are actually quite different: Pathfinder analyses are unbounded (requiring only a starting or ending event), cannot display drop-offs or explore alternative paths taken by users, and do not provide detail on the individual user level. Conversely, Journeys requires both a starting and ending event, provides insight into what users do instead of following a specific path, and can drill into detailed streams of individual users.
Use Pathfinder to:
- Measure the top common paths users take in your product
- Compare properties of events in the paths
- Understand the top paths before or after a specific event
Use Journeys to:
- See how users transition from state A to state B
- Understand your best-performing experiences, and use these to shape your future roadmap
- See which experiences create high-performing customers, and which result in drop-off
- Identify users who had high intent but encountered friction, and retarget them
February 13th, 2026
Need help? Contact Support
Visit Amplitude.com
Have a look at the Amplitude Blog
Learn more at Amplitude Academy
© 2026 Amplitude, Inc. All rights reserved. Amplitude is a registered trademark of Amplitude, Inc.