Introducing Zoning Insights: Web Intelligence at a Glance
Overlay revenue metrics on your website to see what drives conversion for any audience and where to optimize next, all in Amplitude.

Here’s a common scenario. You’re trying to optimize conversion on your website, or someone has a quick question about performance. Either way, all you need to know is what elements on the page are converting customers.
But your website has a lot going on: page layout tests, a new hero banner, an updated recommendations block, and a few different CTAs. Multiply all that by every product and landing page you have.
You open a heatmap. Then a table of URL clicks. Then a conversion funnel, a web experiment report, and another version of the reports filtered by audience. Maybe you ask an AI assistant, and it reads your reports and writes back a paragraph. Each tool shows you glimpses of something real, but none of them answer the question clearly.
One thing is for sure: A “quick question” about web performance shouldn’t take the rest of your afternoon.
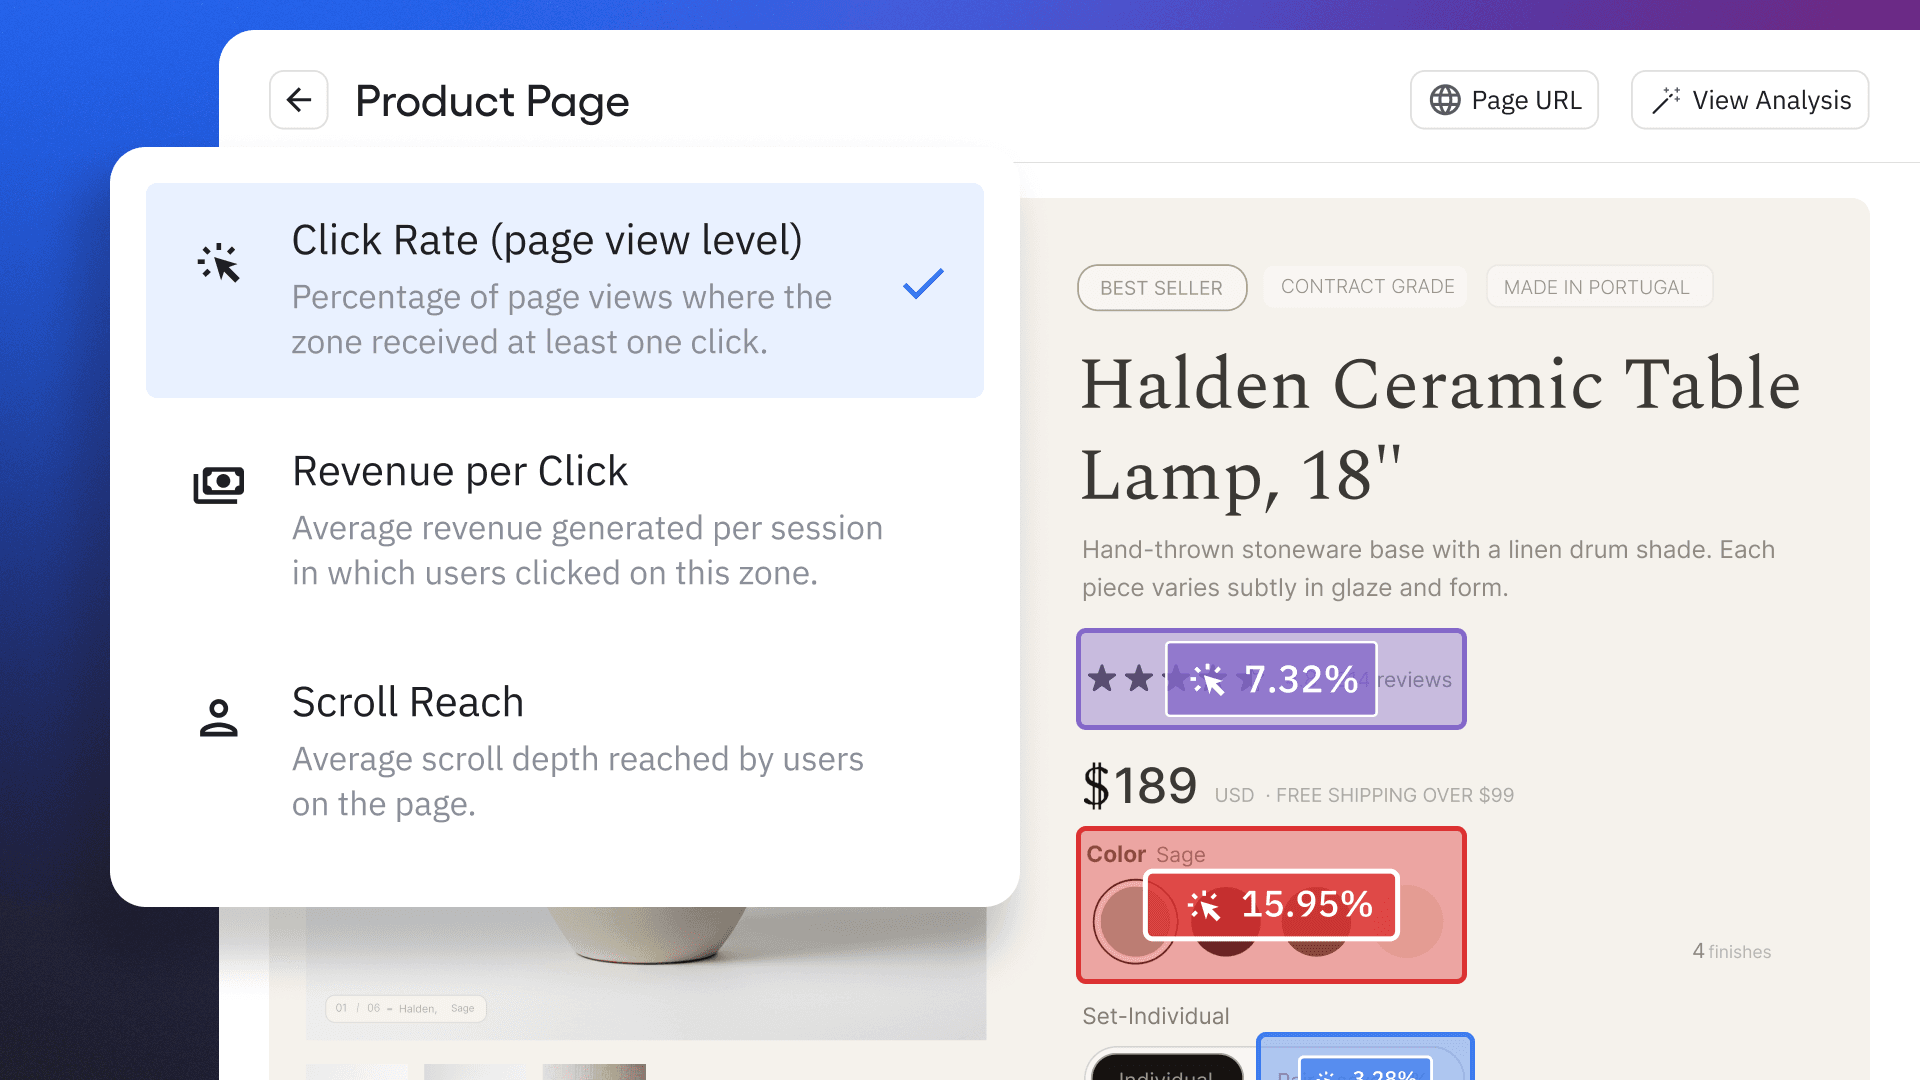
Amplitude Zoning Insights is a visual website intelligence tool that overlays conversion metrics directly on your live pages, so you can see which elements drive revenue for specific audiences without switching between tools. We designed it as part of a continuous loop for website conversion rate optimization, from tracking and insights to native experimentation and taking action.
Heatmaps track engagement, zoning delivers insights
Zoning Insights elevates what heatmaps can tell you in two ways: It shows real conversion rates instead of color gradients, and it groups performance by page element so insights map directly to things you can test and change. That combination makes it easy to prioritize what to fix without reconciling click data across separate reports.
|
Heatmap |
Zoning Insights |
|
|
What you see |
Relative engagement |
Conversion rates, whether that’s click rates or purchase revenue, so that the overlay highlights real business impact |
|
How you see it |
A color gradient |
Data is grouped by page element, so the insights are actual objects you can test and change on your website. Performance can also be aggregated across multiple elements or multiple pages in the same layout. |
During our beta, a leading ecommerce brand used Zoning Insights on their product detail pages. They aggregated performance of product detail pages (PDPs), which includes hundreds of pages for product variants and accessories, and immediately discovered that the “product specs” section of PDPs led to much higher conversion rates than the marketing highlights above. This gave them a clear, data-backed reason to adjust their PDP layout by moving product specs up. The result is an improved customer experience that delivers the information site visitors are looking for as soon as possible.
Without Zoning Insights, they would have been stuck consolidating page reports and element clicks across their PDPs.
Web conversion rate optimization is about relevance
A new visitor and a returning customer behave differently on the same page, and one layout can’t serve both equally well. Zoning Insights goes beyond the aggregate view and lets you filter any zone view by the audience you care about, so you can compare behavior segment by segment and act on what you find, without rebuilding definitions in a separate tool.
Zoning is our starting point. It gives the right level of detail, and based on that, you can segment customers or watch session replays to get a better read on behavior.
Beta customer
When you access Zoning Insights via Amplitude, you’re also automatically tapping into the powerful behavioral tracking, user properties, and real-time cohorts. This means you can filter any zone view by the audience you care about:
- New vs. returning visitors
- Paid vs. organic
- Mobile vs. desktop
- High-intent browsers vs. VIP customers who downloaded your app
Side-by-side comparisons show you whether the differences you suspect are real and by how much. I discovered this myself while using Zoning Insights to dig into why some users were skipping the insights we deliver on our Session Replay homepage. We implemented a “recent events” module that wasn’t performing well, and a segmented report made it clear that customers who hadn’t generated new events in the last 30 days weren’t clicking it at all. Instead, they were highly engaged with the “commonly saved filters” section of the dashboard, so we’re testing a new layout to give users the information they’re looking for faster.
Turn zone insights into targeted experiences
With Zoning Insights, you can build a cohort directly from any zone interaction. For example, start with all the users who clicked through your testimonials. Now you have a high- intent audience that you know cares about third-party validation, and you can target that cohort with:
- A web experiment that highlights case studies on your homepage
- A guide that shows quick testimonials on product pages
- An email that emphasizes any happy reviews or industry awards
It’s easy to understand how different audiences interact with your website and what makes them tick, and then use that targeting to take immediate action.
Everything from find to fix lives in a single place
Web optimization usually requires context-switching: one tool to find the problem, another to align the team on strategy, and one more to build the experiment. And don’t forget your write-up to explain the performance and targeting inconsistencies.
With Zoning Insights built into Amplitude, the entire optimization loop stays in one platform. The zone view where you spot an underperformer is the same place where you build a cohort, launch a test, and confirm results.
This means that you (and your AI tools) have all of the right information in one place.
Instead of taking a report and figuring out what to do next, just click AI Analysis to see a prioritized list of elements to test with suggestions tailored to your page performance. You can validate a suggestion directly in Amplitude Web Experiment, and then compare the experiment’s performance with your original page in the same Zoning Insights side-by-side view.
Tips to continuously optimize your website
Because tracking, insights, and experimentation all live in Amplitude, Zoning Insights gives you a layer of data-backed intelligence to optimize your web conversion rate. Here’s how to get started:
- Set up overlay reports on your highest-traffic pages and create zones to report on your primary conversion metric. Zones connect directly to Amplitude’s behavioral data, so this baseline view updates automatically as your traffic and conversion data flows in (no separate instrumentation required). Want to create zones directly on your website? Unlock our Chrome extension with an advanced Zoning Insights plan!
- Review AI element scoring regularly to surface underperformers before they show up in a revenue report. Amplitude scores each element against your actual conversion data, not a generic benchmark, so every recommendation is specific to your audience.
- Filter zone views by your Amplitude cohorts, such as returning customers, paid traffic, or high-intent visitors. Because these cohorts live in the same workspace as your zone data, you’re analyzing your actual audience without rebuilding definitions in a separate tool.
- Build a cohort from any zone interaction and push it directly into Amplitude Web Experimentation. The audience you identified in the previous step becomes your test segment in this one. Because you’re using the same platform, there’s no translation layer between insight and experiment.
Put together, these steps turn website optimization from a scavenger hunt across tools into a single, continuous loop. So the next time someone asks a “quick question” about website performance, you’ll actually have a quick answer.
Register to join me for a live webinar on July 7, including a demo and Q&A, or check out this on-demand Academy course.

Chad Swenson
Principal Product Manager, Amplitude
Chad Swenson is a Principal Product Manager at Amplitude, where he focuses on Session Replay, Heatmaps, and Zoning Insights.
More from ChadRecommended Reading

Beyond the Rate: Retail Banking's New Competitive Front
Jul 20, 2026
13 min read

How NS Prevented €1.8M in Revenue Loss Through Experimentation
Jul 20, 2026
7 min read

Go from Product Launch to Insight to Action in Minutes
Jul 20, 2026
3 min read

What Makes a Good vs Bad North Star Metric
Jul 15, 2026
13 min read