Introducing Product Benchmarks
A behind-the-scenes look at why and how we built the largest free product benchmarks database.
Benchmarks are crucial for understanding how your performance compares to others, but getting reliable and actionable product benchmarks has long been a challenge—until now.
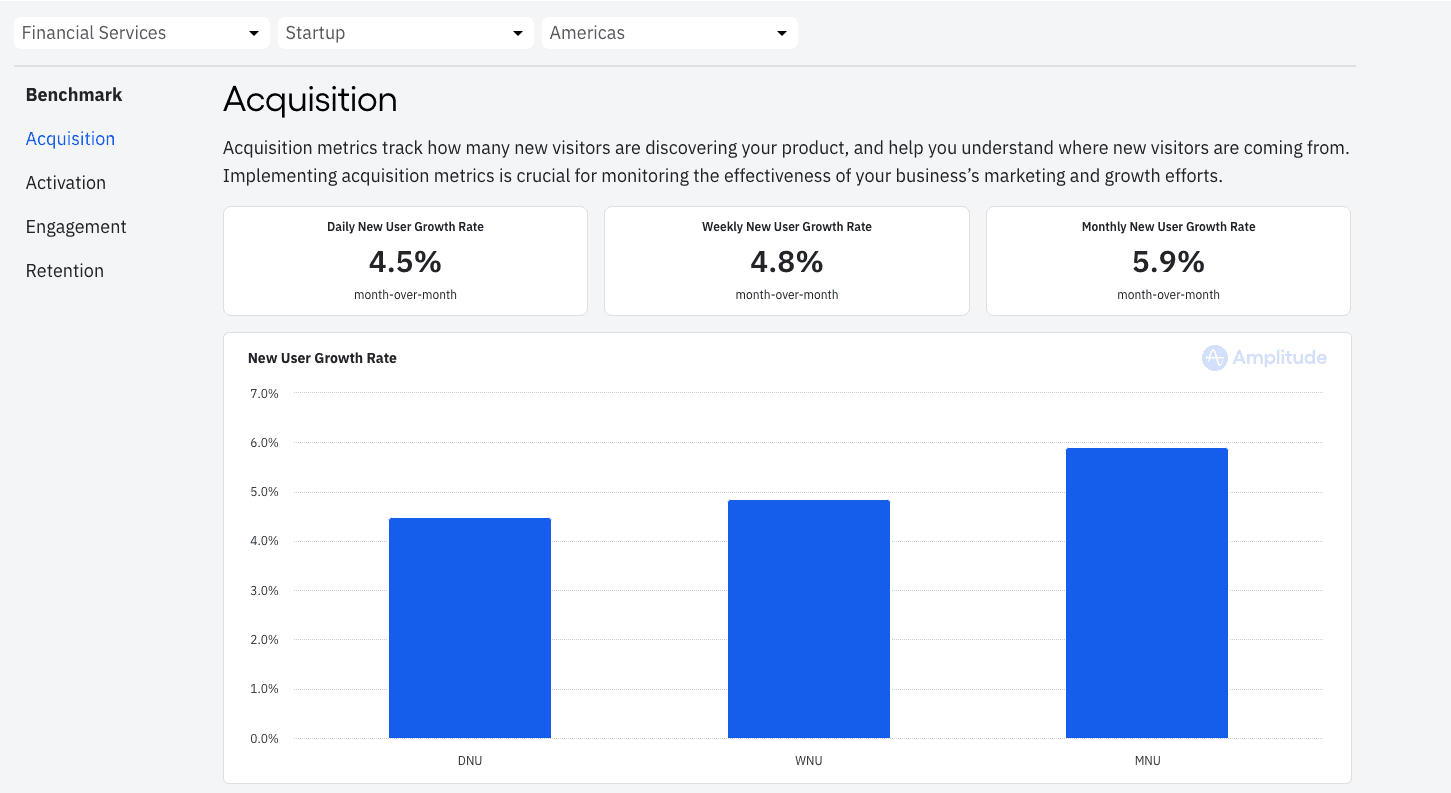
We’re excited to introduce Amplitude’s Product Benchmarks, a free tool offering interactive benchmark data you can segment by industry, region, and company size.
Aggregated and anonymized from more than 2,300 organizations worldwide, our new tool offers the largest dataset of product benchmarks available to every product manager, analyst, and marketer who wants to see how they stack up.
Inspired by customer demand
For years, our customer success and sales teams have used Amplitude to help customers answer the question, “How do I tell if my metrics are good?” We’ve heard the same request from prospects, community members, and even our Ampliteers. Tasked with driving new user growth, I’ve often found myself asking how I measure up.
“Right now, I need better activation and retention metrics—with industry benchmarks. So not just, 'Is this result significant?' but also 'What even is good?'"
Amplitude customer
Our growth marketing and growth product teams brainstormed how to harness the power of Amplitude to create product benchmarks. We wanted to equip product teams with data to help them learn and demonstrate the kind of insights our platform offers.
We shipped fast for impact
To get this tool to users quickly (and so we could start learning), we prioritized metric categories that were most meaningful for users and easiest to bring to production.
Acquisition, activation, engagement, and retention were clear choices to benchmark first. These categories map to a typical product lifecycle, and they are straightforward to aggregate from our database.
The one category we decided to forgo is monetization. Monetization is the cornerstone of any product strategy, but aggregating this data into one or two metrics would not be simple, and its definition can vary by organization. In the future, we’re excited to explore creating monetization benchmarks via other techniques.
Analyze benchmarks by industry, region, and company size
We believe benchmark data is only as useful as its specificity, so you can segment every metric by company industry, region, and size. These segments can also be combined, so a finance startup in Japan can understand exactly how their app compares to similar products.

Use benchmarks to assess your product performance
Sign up for Amplitude to start tracking your key metrics, such as your new user growth rate and day-seven retention rate. Using our benchmarking tool, you can assess how you compare to industry standards and help your team:
- Better understand your product’s growth and engagement
- Identify metrics that are underperforming
- Set realistic annual and quarterly goals
Explore Amplitude's Product Benchmarks tool and discover how your product compares.

Katie Geer
Former Growth Marketing Manager, Amplitude
Katie is a former growth marketing and product manager at Amplitude focused on acquisition. Previously she was in product at Redfin where she focused on experimentation and data instrumentation.
More from Katie


