Extreme Makeover: Amplitude Edition (Thoughts on our New UI)
For the past couple of months, our engineers have been hard at work on something big…

For the past couple of months, our engineers have been hard at work on something big…so we’re happy to finally get the chance to unveil our new design today! Building and testing the new UI took a concerted team effort and involved a lot of back-and-forth between us and our current users. Along the way, we learned a lot about how our users are interacting with and experiencing our dashboards, and we poured that into the new design.
For those unfamiliar with our product, Amplitude is a comprehensive analytics dashboard for mobile and web applications. Our customers use us to understand how their users are interacting with their apps. As such, we want our dashboards to be both informative and easy to use for developers, as well as marketers and business intelligence teams who may have less technical know-how.
Our new UI is still very much a work in progress, as we’re getting feedback and ideas on ways to improve its usability every day. We thought it’d be fun to go over the before and after of our UI and talk a little about how we got to our new design, as well as get thoughts on what we can still improve.** If you’re not using Amplitude yet, you can play with the new UI in our demo. We’d love your thoughts in the comments or at support@amplitude.com!**
Overall look
Before:
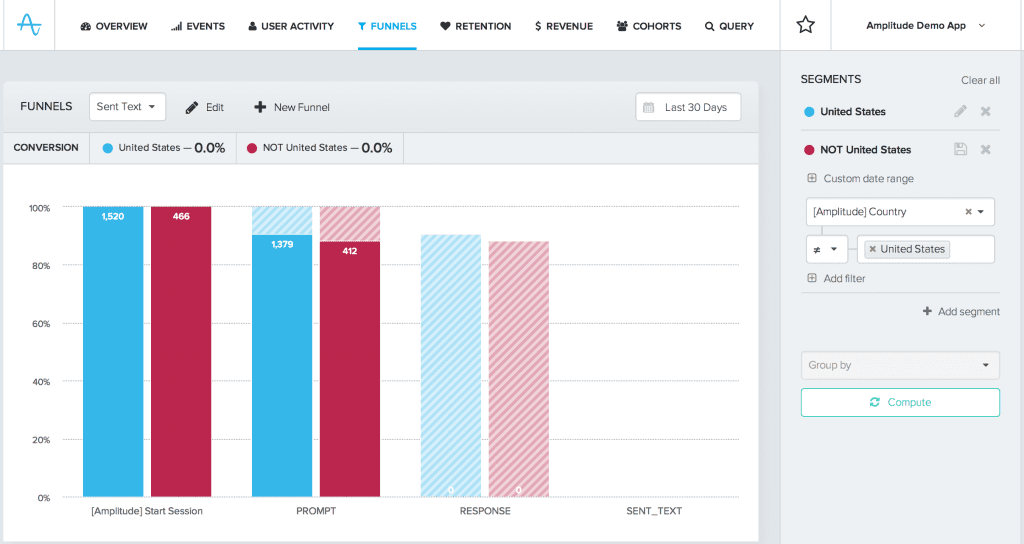
After:
There’s no question the new UI is way more appealing visually. Of course, in addition to just looking better, we also wanted to make sure the new user interface was more intuitive and easier to use than our previous dashboard. Here are some of the key changes we’ve made so far:
Segments – now consistent across tabs
Segmentation is one of the most-used functions of our dashboard. You can slice and dice different user groups, or segments, by properties like Country, Language, and App Version. However, we knew the placement of our segment buttons wasn’t incredibly intuitive in our old UI, and was also inconsistent across different tabs.
Before:
In the Overview tab, the ‘Add Segment’ button was over here:
But in the other tabs that have segmentation (Events, Funnels, Retention, and Revenue), the button was all the way to the right:
Another issue was that as you added more segments, the space above the graph quickly got crowded and pushed the graph down. This didn’t seem like a good use of space and also wasn’t ideal since you couldn’t see both the segment definitions and graph in the same view:
After:
We changed 2 major things about segments in the new design:
- We now have a segment sidebar whose location is consistent across ALL tabs that offer segmentation (Overview, Events, Funnels, Retention, Revenue).
- Segments themselves are also consistent across all tabs. That is, if you make 3 segments in the Events tab, when you click over to Funnels or Retention, those segments will already be there and will be applied to your data.
Once you click the ‘Compute’ button, the segment definitions collapse to save space, and a useful description remains: We also made a few minor adjustments to improve usability:
- When defining segments, you can now do substring matching via ‘contains’ and ‘does not contain’, instead of only being restricted to ‘is’ and ‘is not’.
- The ‘Add segment’ button follows you as you add more segments, rather than staying at the top of the screen.
- We also added a ‘Clear all’ option in the top right corner for getting rid of all of the current segments to start fresh. Previously, you had to individually ‘x’ out each individual segment to clear it.
Like we said earlier, this redesign really is an ongoing process. In the course of writing up this post, we’ve already gotten some more user feedback that has caused us to rethink the Segments design. We realized that the ‘Add segment’ option often gets overlooked by first time users — so we’ll be making some changes to make it more prominent and button-looking in the near future.
Events tab revamped
We knew that our Events tab needed a pretty big overhaul. This tab lets you keep track of important actions, or events, that users are making in your app.
Before:
Previously, the default screen when you clicked to the Events tab was just a list of all of your events, and a count of how many times the event has occurred that week: Once you clicked on an individual event name (like ‘GOOGLE_RESPONSE’), it would take you to the graphical interface where you could segment by user and event properties:
After:
We really wanted a better default view than a list of all of the Events. This was one of the harder problems we dealt with during the redesign — what could we put instead that would still give our users a lot of high-level information about their events, with the ability to dig down deeper? We wanted the default view to be more informative than just the weekly counts, and we also wanted to make it possible to start segmenting without needing to click through a specific event to a new page. Here’s what we came up with: We added tabs across the top that let you analyze your events in different ways: ‘Properties’, for digging into event properties, and ‘Segmentation’, for looking at events across different user segments. The default view for the Events tab now shows a summary graph of your top 5 most common events. Underneath this is a table showing information about all of your events. This table is clickable, so that you can add or remove events from the graph view just by clicking the event name:
Better bookmarks
This is almost more of a feature improvement than a UI thing.
Before:
In our old dashboards, Bookmarks were only available for saving a defined funnel for later use.
After:
Now, you can make Bookmarks on any tab. This makes it easy to save a certain graph view that you look at frequently, or to share the views with the rest of your team. Bookmarks are easily accessed from the top menu bar:
The case of the disappearing ‘group by’
One design aspect we struggled with was what to do with features that weren’t available under certain conditions. This happens with our ‘Group by’ function, which makes it really simple to immediately divide out groups of users by a certain property (ex. ‘Group by country’ or ‘Group by OS’). You can apply ‘Group by’ to all users, or to a single segment, but not once you’ve defined 2 or more segments. In our old dashboards, the ‘Group by’ field disappeared once you added an additional segment.
Before:
With one segment: With two segments:
After:
We weren’t a huge fan of the inconsistency here, and thought it might be confusing as well. In the new design, we decided to just gray out features that weren’t applicable, with a little popup explanation:
Feedback please!
We hope you enjoy the newly made-over Amplitude! There are a few new features in our User Activity and Funnels tabs that we didn’t get to in this post, so check them out. If you’re already a customer, definitely let us know your feedback at support@amplitude.com. If you’re not an Amplitude user yet, please poke around our demo and also let us know what you think! Happy analyzing 🙂

Alicia Shiu
Former Growth Product Manager, Amplitude
Alicia is a former Growth Product Manager at Amplitude, where she worked on projects and experiments spanning top of funnel, website optimization, and the new user experience. Prior to Amplitude, she worked on biomedical & neuroscience research (running very different experiments) at Stanford.
More from Alicia


