Better Data Brings Better Content at Disney+ Hotstar
By prioritizing data governance, the product team at Disney+ Hotstar was able to make sense of customer behavioral data—and use those insights to drive stickiness across markets.

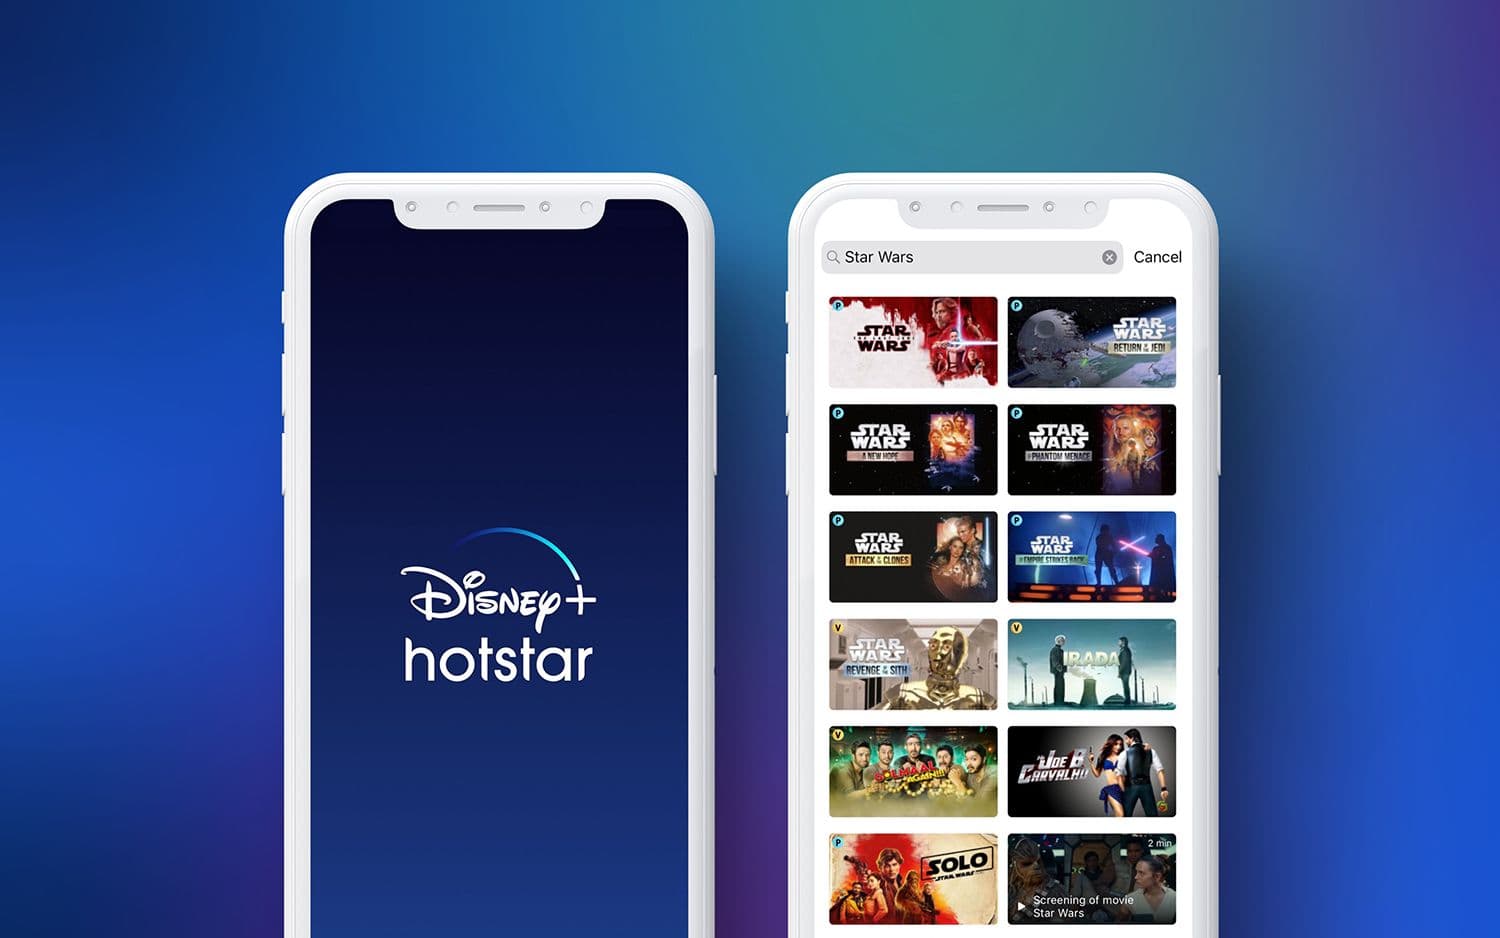
Streaming has transformed the way people watch television. Rather than passively flipping through channels that feature scheduled programming, viewers scroll through live and on-demand options, picking favorites and taking chances on new content from around the world. The easier it is for viewers to discover content that matches their tastes and preferences, the more engaged they become with the service.
Launched in 2015, Hotstar quickly gained popularity with Indian audiences and expanded to serve expatriate communities in Canada, Singapore, the United Kingdom, and the United States. In 2019, we were acquired by Disney and rebranded as Disney+ Hotstar. Today, Disney+ Hotstar is India’s most popular streaming service with more than 300 million users. We recently launched the integrated product in Indonesia and are poised to expand the offering to Malaysia, the Philippines, and Thailand.
With this growth, we had three challenges in front of us: to improve our data governance, make sense of all the data we were collecting, and harness that data to increase user stickiness in multiple markets. Luckily, we were able to partner with Amplitude to solve these challenges.
Standardizing and Understanding Our Data as We Grew
As our director of product, I am responsible for driving growth and user engagement. My team strives to provide viewers with enhanced personalization and the best discovery and recommendation experience. This leads to high engagement and, in turn, high retention rates.
On top of enhanced discovery, we have added interactive features to our sports offerings to boost engagement including on-screen scorecards, game summaries, and simulated “in-person” experiences. In late 2020, for example, international cricket matches were played in empty stadiums due to the pandemic, which resulted in a dulled viewer experience. To recreate the excitement a crowd at a normal match would bring, we asked viewers to input emojis while watching, analyzed the sentiments in real-time, and played appropriate crowd noises like cheers in response.
When I started at Disney+ Hotstar, I was tasked with boosting our personalization features. To do this, I needed credible data, but I was dealing with a “garbage-in, garbage-out” situation. Our data wasn’t standardized, and there was no real attribution. Nobody could even explain the event definitions.
If your data isn't credible, you cannot expect teams to make data-driven decisions. Click To Tweet
Our first step, then, was to clean up all of our data. I spent that first year learning why we generated the information that we did and what we wanted it to tell us. We identified trigger points along the user journey and defined the expected variables we needed to create actionable data models. We also established acceptable data-point values and ranges for quality control purposes and determined the variables and events we needed to track.
After we cleaned up the data and assured its quality, we knew we could trust it.
Using Data to Increase Stickiness
Our international growth has added complexity to our user acquisition and retention strategy. We don’t want to reinvent the wheel every time we expand into a new country, but we also know that what works in one market may not succeed in another. We need to recognize what moves the needle in different countries, which means understanding how user preferences and experiences differ from one geographic region to the next.
The scale of our data collection is unprecedented; we set the record for the highest number of simultaneous users on our app with 25.3 million people watching the 2019 India-New Zealand cricket semi final. In late 2019, we were generating 16 million data points daily, and that figure has risen with our expansion.
We embarked on our analytics journey by looking at user cohort and user funnel data, which led to multiple A/B tests every month. We then started exploring ways to increase user stickiness. We wanted viewers to come back more often and spend more time on our service, which required new ways of analyzing all the data we collected. We found a solution in Amplitude.
Self-serve Analytics for Digital-first Businesses
I wanted my team to access data without friction and reduce the time needed to get actionable insights. Amplitude excels at all of this and provides multiple views into our data. Amplitude is a self-service digital optimization system, which offers a robust analytics platform for enterprises. It democratizes data access and helps digital teams better understand user behavior and how customers experience digital products like ours.
We demoed a bunch of different analytics platforms and found Amplitude after reading some great reviews. It won us over with its scalability, ease of use, integrations, and affordability.
Their team was brilliant from the start. Every conversation we have with vendors includes a discussion of our volume of data and the need to scale on a budget. During our initial conversations with Amplitude, we presented our priorities and they introduced us to the idea of sampling small chunks of data.
When you have data at scale, you don’t need to analyze every individual data point to get the most accurate insights. If we were to sample five percent of any data set, for example, we could get the exact same level of insight—with 99% confidence in the findings. It obviously takes less time to analyze less data, and that means that sampling leads to faster decision making.
They were the only vendor to offer a sampling solution that matched our needs, and they instantly won our trust and our business.
Testing Multiple Hypotheses with Ease
The boost in speed and accuracy from Amplitude was only half of the story. Amplitude integrates seamlessly with our technology stack. We built a custom pipeline in-house that collects and routes it to our data warehouse and our CRM. We added an Amplitude integration and now use Amplitude’s APIs and data governance features to standardize and synchronize user data across all three destinations. The result is a consolidated user profile that provides a single source of truth across our data stores and analytics tools.
With Amplitude, we can parse user cohorts based on when they joined the service and the content that drew them to Disney+ Hotstar. We start collecting data right away and can track engagement in weekly, monthly, and even six-month time periods. We can even look at a cohort of new users who signed up two weeks ago, determine whether their engagement levels reflect our benchmarks, and if not, adjust our messaging to them. We can also analyze the behavior of long-term subscribers and add new content if we see they’re being driven away by a lack of novelty.
With intuitive analytics tools, team members who aren’t data specialists can still fashion complex technical queries and receive results that are easy to understand. Click To Tweet
Amplitude also allows us to analyze user patterns and perform A/B tests based on geographic location, language, genre, or any other parameter that comes to mind. Do viewers in Singapore prefer content in English, Malayalam, or Tamil? Are Punjabi subscribers more interested in sports than Hindi-speaking subscribers? Do viewers who binge-watch television series watch as many hours of movies? The possibilities are endless. That’s all thanks to how easy it is for anyone to ask and answer questions in Amplitude.
Democratizing Data for Non-specialists
With Amplitude, we can provide faster, actionable insights to more people without increasing the size of our data science team, even as Disney+ Hotstar continues to grow. It’s an intuitive tool that allows team members who aren’t data specialists a way to fashion complex technical queries. From there, they can view the results as easy-to-understand charts and graphs.
I’ve seen an increase across our entire organization in the number of people who access Amplitude data every month, as well as the number of reports being generated and shared. These numbers are proof that our people have a high level of confidence in the platform and value the insights it generates. Amplitude excels at bringing everyone to the table for the benefit of our subscribers.
More Happy Subscribers
Amplitude has given us the tools to track engagement across the entire user journey. It provides us with a clear picture of what viewers are watching, when they’re watching it, and where they go after they’ve watched it. We can personalize the viewer experience and optimize recommendations to deliver the most engaging content to our users.
Hotstar was the biggest streamer in India before the Disney acquisition. We are still number one, but we aren’t simply focused on scaling. Instead, we are committed to acquiring and retaining more subscribers by building a better user experience. And if we’re successful, those users will keep tuning in for more.

Shobhit Singhal
Director of Product, Disney+ Hotstar
Shobhit Singhal is director of product at Disney+ Hotstar, where he leads user engagement on a team composed of product managers, engineers, designers and data scientists that's more than 75 people strong. Shobhit provides oversight on personalization, product innovation, user intelligence, customer data, and more for Disney+ Hotstar.
More from Shobhit


