Platform

AI

AI Agents
Sense, decide, and act faster than ever before
AI Visibility
See how your brand shows up in AI search
AI Feedback
Distill what your customers say they want
Amplitude MCP
Insights from the comfort of your favorite AI tool

Insights

Product Analytics
Understand the full user journey
Marketing Analytics
Get the metrics you need with one line of code
Session Replay
Visualize sessions based on events in your product
Heatmaps
Visualize clicks, scrolls, and engagement

Action

Guides and Surveys
Guide your users and collect feedback
Feature Experimentation
Innovate with personalized product experiences
Web Experimentation
Drive conversion with A/B testing powered by data
Feature Management
Build fast, target easily, and learn as you ship
Activation
Unite data across teams

Data

Warehouse-native Amplitude
Unlock insights from your data warehouse
Data Governance
Complete data you can trust
Security & Privacy
Keep your data secure and compliant
Integrations
Connect Amplitude to hundreds of partners
Solutions
Solutions that drive business results
Deliver customer value and drive business outcomes
Amplitude Solutions →

Industry

Financial Services
Personalize the banking experience
B2B
Maximize product adoption
Media
Identify impactful content
Healthcare
Simplify the digital healthcare experience
Ecommerce
Optimize for transactions

Use Case

Acquisition
Get users hooked from day one
Retention
Understand your customers like no one else
Monetization
Turn behavior into business

Team

Product
Fuel faster growth
Data
Make trusted data accessible
Engineering
Ship faster, learn more
Marketing
Build customers for life
Executive
Power decisions, shape the future

Size

Startups
Free analytics tools for startups
Enterprise
Advanced analytics for scaling businesses
Resources

Learn

Blog
Thought leadership from industry experts
Resource Library
Expertise to guide your growth
Compare
See how we stack up against the competition
Glossary
Learn about analytics, product, and technical terms
Explore Hub
Detailed guides on product and web analytics

Connect

Community
Connect with peers in product analytics
Events
Register for live or virtual events
Customers
Discover why customers love Amplitude
Partners
Accelerate business value through our ecosystem

Support & Services

Customer Help Center
All support resources in one place: policies, customer portal, and request forms
Developer Hub
Integrate and instrument Amplitude
Academy & Training
Become an Amplitude pro
Professional Services
Drive business success with expert guidance and support
Product Updates
See what's new from Amplitude

Tools

Benchmarks
Understand how your product compares
Templates
Kickstart your analysis with custom dashboard templates
Tracking Guides
Learn how to track events and metrics with Amplitude
Maturity Model
Learn more about our digital experience maturity model
Pricing
LoginContact salesGet started

AI

AI AgentsAI VisibilityAI FeedbackAmplitude MCP

Insights

Product AnalyticsMarketing AnalyticsSession ReplayHeatmaps

Action

Guides and SurveysFeature ExperimentationWeb ExperimentationFeature ManagementActivation

Data

Warehouse-native AmplitudeData GovernanceSecurity & PrivacyIntegrations
Amplitude Solutions →

Industry

Financial ServicesB2BMediaHealthcareEcommerce

Use Case

AcquisitionRetentionMonetization

Team

ProductDataEngineeringMarketingExecutive

Size

StartupsEnterprise

Learn

BlogResource LibraryCompareGlossaryExplore Hub

Connect

CommunityEventsCustomersPartners

Support & Services

Customer Help CenterDeveloper HubAcademy & TrainingProfessional ServicesProduct Updates

Tools

BenchmarksTemplatesTracking GuidesMaturity Model
LoginSign Up

Don’t Let Big Data Cleanup Get in the Way of Insights

Data scientists spend between 50 - 80% of their time on the mundane work of big data cleanup.
Insights

Oct 15, 2014

4 min read

Alicia Shiu

Alicia Shiu

Former Growth Product Manager, Amplitude

Don’t Let Big Data Cleanup Get in the Way of Insights

A recent article in the New York Times expounded on the woes of working in one of today’s most buzz-worthy fields: big data. The article estimated that data scientists spend between 50 – 80% of their time on the mundane work of big data cleanup.

As Monica Rogati, VP for data science at Jawbone, put it:

“It’s something that is not appreciated by data civilians. At time, it feels like everything we do.”

If you’re reading this blog, chances are you already know that raw data is incredibly messy, and there’s a lot of data wrangling that needs to be done before you can start to run fancy algorithms over your data to glean insights. If you’re a data scientist tasked with discovering insights from user behavior on your app, you definitely know this.

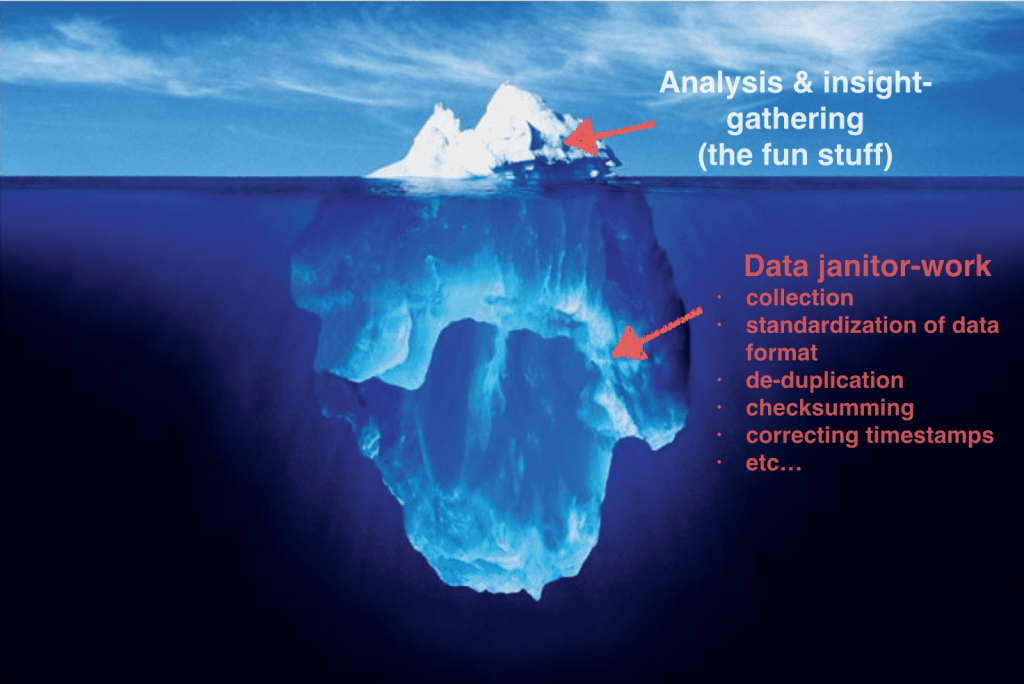
Imagine for a moment just how many ways data can get mangled when you’re collecting streaming data from hundreds of millions of smartphones and tablets, which have hundreds of thousands of different software configurations, which are running on tens of thousands of different platforms — at the same time. Think about how much work it would take a team of data scientists to cleanup that data and transform it into a uniform, readable format, and face the daunting task of deduplicating and validating that data.

And only then is it time to find ways to analyze that data and draw out useful insights — the stuff your CEO actually wants to know.

Leave the data cleanup to us

Luckily for you, we’ve got the data cleanup covered. We’ve already figured out all the ways that your data can go wrong and how to fix them, so that you don’t have to. (In fact, our CEO Spenser recently gave a tech talk on this very topic, so check it out.)

We’ve also put your data in a nice, tidy format that’s ready for you to explore on our dashboards or, if you’re really into it, stored in a SQL Redshift database for you to run queries on to your data-loving heart’s content.

Don’t forget about data visualization

Once the data is cleaned up, of course, there’s the problem of figuring out how to represent the data visually. Once again, we do the dirty work so you can get straight to the fun part. We constructed our dashboards with the sole purpose of visualizing and investigating user data in useful, actionable ways, so that you can easily see metrics like daily active users, funnel dropoffs, and nth day user retention.

One example of the data visualization we do: real-time retroactive funnels. You can set up your funnel steps in a few clicks and visualize conversion rates for different segments, or user groups. Funnels show you exactly where your users are dropping off, and segmenting by user properties helps you figure out why.

real-time retroactive funnels

In addition, there are a number of companies that specialize in visualizing whatever data you send their way: just hook it up and you’ll get beautiful graphs and pie charts ready for presentation. These include Tableau, Chartio, Periscope, and Looker, to name a few. These tools can take data from multiple sources — for example, Google Analytics, your CRM, and Amplitude — and create custom visualizations based on your needs.

Some of our customers integrate their Amplitude SQL Redshift database to one of these visualization tools for even more custom, in-depth analysis of their data.

More time to focus on your product

So what does all of this mean? If you want to understand how users are interacting with your app, you don’t have to spend 80% of your precious time on data janitor work.

That leaves more time for the really important stuff: finding user insights and improving your product.

About the author
Alicia Shiu

Alicia Shiu

Former Growth Product Manager, Amplitude

More from Alicia

Alicia is a former Growth Product Manager at Amplitude, where she worked on projects and experiments spanning top of funnel, website optimization, and the new user experience. Prior to Amplitude, she worked on biomedical & neuroscience research (running very different experiments) at Stanford.

More from Alicia
Topics
Platform
  • Product Analytics
  • Feature Experimentation
  • Feature Management
  • Web Analytics
  • Web Experimentation
  • Session Replay
  • Activation
  • Guides and Surveys
  • AI Agents
  • AI Visibility
  • AI Feedback
  • Amplitude MCP
Compare us
  • Adobe
  • Google Analytics
  • Mixpanel
  • Heap
  • Optimizely
  • Fullstory
  • Pendo
Resources
  • Resource Library
  • Blog
  • Product Updates
  • Amp Champs
  • Amplitude Academy
  • Events
  • Glossary
Partners & Support
  • Contact Us
  • Customer Help Center
  • Community
  • Developer Docs
  • Find a Partner
  • Become an affiliate
Company
  • About Us
  • Careers
  • Press & News
  • Investor Relations
  • Diversity, Equity & Inclusion
Terms of ServicePrivacy NoticeAcceptable Use PolicyLegal
EnglishJapanese (日本語)Korean (한국어)Español (Spain)Português (Brasil)Português (Portugal)FrançaisDeutsch
© 2025 Amplitude, Inc. All rights reserved. Amplitude is a registered trademark of Amplitude, Inc.
Blog
InsightsProductCompanyCustomers
Topics

101

AI

APJ

Acquisition

Adobe Analytics

Amplify

Amplitude Academy

Amplitude Activation

Amplitude Analytics

Amplitude Audiences

Amplitude Community

Amplitude Feature Experimentation

Amplitude Guides and Surveys

Amplitude Heatmaps

Amplitude Made Easy

Amplitude Session Replay

Amplitude Web Experimentation

Amplitude on Amplitude

Analytics

B2B SaaS

Behavioral Analytics

Benchmarks

Churn Analysis

Cohort Analysis

Collaboration

Consolidation

Conversion

Customer Experience

Customer Lifetime Value

DEI

Data

Data Governance

Data Management

Data Tables

Digital Experience Maturity

Digital Native

Digital Transformer

EMEA

Ecommerce

Employee Resource Group

Engagement

Event Tracking

Experimentation

Feature Adoption

Financial Services

Funnel Analysis

Getting Started

Google Analytics

Growth

Healthcare

How I Amplitude

Implementation

Integration

LATAM

Life at Amplitude

MCP

Machine Learning

Marketing Analytics

Media and Entertainment

Metrics

Modern Data Series

Monetization

Next Gen Builders

North Star Metric

Partnerships

Personalization

Pioneer Awards

Privacy

Product 50

Product Analytics

Product Design

Product Management

Product Releases

Product Strategy

Product-Led Growth

Recap

Retention

Startup

Tech Stack

The Ampys

Warehouse-native Amplitude

Recommended Reading

article card image
Read 
Customers
The Future is Data-Driven: Introducing the Winners of the Ampy Awards 2025

Dec 2, 2025

6 min read

article card image
Read 
Insights
Marketing Analytics in 2026: Predictions from the People Who Measure Everything

Nov 25, 2025

9 min read

article card image
Read 
Customers
Amplitude Pathfinder: How Dan Grainger Bet on Amplitude & Won

Nov 25, 2025

16 min read

article card image
Read 
Product
Getting Started: Driving Product Engagement by Obsessing Over Activation

Nov 24, 2025

4 min read

Explore Related Content

Integration
Using Behavioral Analytics for Growth with the Amplitude App on HubSpot

Jun 17, 2024

10 min read

Personalization
Identity Resolution: The Secret to a 360-Degree Customer View

Feb 16, 2024

10 min read

Product
Inside Warehouse-native Amplitude: A Technical Deep Dive

Jun 27, 2023

15 min read

Guide
5 Proven Strategies to Boost Customer Engagement

Jul 12, 2023

Video
Designing High-Impact Experiments

May 13, 2024

Startup
9 Direct-to-consumer Marketing Tactics to Accelerate Ecommerce Growth

Feb 20, 2024

10 min read

Growth
Leveraging Analytics to Achieve Product-Market Fit

Jul 20, 2023

10 min read

Product
iFood Serves Up 54% More Checkouts with Error Message Makeover

Oct 7, 2024

9 min read