A Guide to User Behavior Analytics (UBA): How to Track & Analyze
Understanding how to track user behavior analytics will help you make customer experience your core differentiator.

Originally Published on April 15, 2022
- What is user behavior analytics (UBA)?
- Why is it important for companies to track user behavior analytics?
- Benefits of analyzing user behavior
- Four types of user behavior analytics
- Key metrics for collecting behavioral data
- How to analyze user behavior
- Examples of behavioral data analysis
- Common mistakes when analyzing user behavior
- User behavior leads to better product initiatives
User behavior is the set of actions and patterns that users demonstrate when interacting with your product. Tracking and analyzing user behavior will help you evaluate what users value and enable you to improve their experience.
It's also important to note that user behavior is not marketing behavior—what you analyze in website analytics tools like Google Analytics. Web analytics tools give you data focused on acquisition and marketing interactions before the person became a user of your product. User behavior is about people who are already active users.
User behavior focuses on metrics such as signups and conversion rates, activation rates, feature usage and impact, funnel drop-off for in-app purchases, and retention rates. For example, you can gain insight into the effect of pricing changes on retention or the popularity of a feature in a cohort of users.
Acting on user behavior data will help your team become product-led and customer experience-driven. You'll make product development and product marketing decisions based on actionable insights rather than guesswork.
- Tracking and analyzing user behavior helps you improve the product experience and strategy.
- Experience is everything. Leveraging user behavior data helps you turn the customer experience into your competitive advantage.
- User behavior is the key to feedback loops and data-driven decisions based on actionable insights.
- Feature usage and impact, stickiness, retention, activation rate, and funnel drop-offs are examples of user behavior metrics.
- Journeys, cohorts, conversion paths, engagement matrices, and anomaly tracking are used in user behavior analysis.
- Case studies from a number of companies, such as Under Armour, Calm, DoorDash, and Babel, show that user behavior can uncover opportunities for improvement that lead to large increases in retention or activation.
- Common mistakes in optimizing for user behavior include shipping too much at once, not instrumenting properly, overdoing the number of tracked events, and not collecting user feedback.
What is user behavior analytics (UBA)?
User behavior analytics (UBA) is a process for tracking and monitoring how users act on a website or mobile app. In product and marketing analytics, UBA means focusing on behavior patterns and user interactions—what users do, what they like, and how they engage with different parts of your product. UBA is crucial in industries like ecommerce, where tracking interactions such as browsing habits and purchase history can help improve the customer experience.
Monitoring UBA involves tracking quantitative data, like clicks, signups, and feature usage. Collecting this data helps you see more nuanced information about user interactions, like the frequency of engagement and the context behind those actions. It gives you a clear picture of which features are relevant to your audience, where they're dropping off, and what motivates them to engage more deeply.
Understanding user behaviors enables you to anticipate customer needs better and improve their experience, creating a seamless, tailored experience that keeps them engaged and coming back for more.
Why is it important for companies to track user behavior analytics?
Customer experience is everything; user behavior helps you understand, prioritize, and improve the experience. This mindset was essential for product-centric companies like Netflix, Airbnb, Slack, and Peloton. These brands entered saturated markets in their respective categories but offered unique experiences that they kept improving based on user behavior. As a result, they succeeded in standing out from the crowd.
Another product company known for its experience is DoorDash, which offers an app and a web version. For most companies like DoorDash, the goal is to streamline how people add to their cart and simplify the buying process. They could improve the functionality of their apps and websites separately—which is a common approach—but DoorDash is striving for a more cohesive experience for their customers. As a result, users can go to the DoorDash website, place orders, and get real-time updates via the app.
Creating a seamless omnichannel experience doesn't happen effortlessly. It's important to connect the dots for your users and understand how they behave across platforms. With this insight, you can use conscious design and experimentation to create the most rewarding experiences.
Benefits of analyzing user behavior
The following benefits can make major contributions to a brand's success:
- Create an experience that becomes your differentiator and growth engine. Jumbo grew and got the customer experience right thanks to personalizing experiences without triggering privacy concerns.
- Develop and innovate at scale. TicketSwap used Amplitude Audiences to understand user behavior. It used the data from Amplitude to develop innovative ways to reduce the number of unsold tickets and improve the platform's functionality. Its efforts led to a 10% revenue increase.
- Mitigate the risk of investing in the wrong product initiatives and features. A+E Networks uses Amplitude to run A/B tests on key streaming features to identify which features customers use most and least. By understanding which features increase and decrease engagement, A+E can improve its feature offerings and avoid investing in less effective updates.
- Increase conversions, retention, and revenue. Super.com increased retention by 90% by learning what makes their users feel rewarded and acting on that insight.
Four types of user behavior analytics
Here are four of the most common ways to track and analyze user behavior in product analytics:
1. A/B testing & experimentation
A/B testing is an experimentation method that compares two or more versions of a feature, design, or piece of content to determine which performs better in terms of user interactions. It enables product teams to understand how variations of an element (e.g., button color, messaging) affect user engagement or conversions.
A/B testing splits users into groups, each receiving a different variation of the tested element. Testing hypotheses with real users enables data-driven decision-making rather than assumptions or guesswork.
Teams typically use A/B testing to improve the user interface, onboarding flow, pricing models, or marketing campaigns. For example, if a team wants to test whether a new onboarding flow results in higher activation rates, A/B testing can provide actionable insights into which version works best.
2. Segmentation analysis
Segmentation analysis means dividing users into specific groups or cohorts based on shared behaviors, demographics, or other characteristics. In product and marketing analytics, segmentation enables you to target and personalize experiences for different users more effectively. It's essential for understanding and addressing the needs of your target audience and user personas.
One of the primary use cases for segmentation in analytics is personalization and tailoring your product strategies to specific user behaviors. For example, ecommerce companies often use segmentation to identify groups of users based on their in-app behavior. They might analyze users who frequently engage with certain product categories but haven't made a purchase. Teams can use insights from their analysis to improve the user experience by enhancing navigation or recommending relevant products directly within the app.
3. Funnel analysis
Teams use funnel analysis to track and visualize the customer journey. It shows you how users move through a series of predefined steps within your website or app.
Each step in the funnel is a specific action a user completes, like signing up, purchasing, or setting preferences. The goal is to understand where users are dropping off and how to improve conversions at each stage.
Funnel analysis is particularly valuable in user onboarding, conversion rate optimization, and product feature rollouts. For example, SaaS companies often use it to monitor how users navigate through free trials and convert to paying customers.
Funnel analysis enables teams to pinpoint friction points or barriers that cause drop-offs. For example, users might abandon a purchase after they add a product to their cart but before completing checkout. By analyzing each step of the funnel, teams can A/B test different solutions, such as simplifying the checkout process, to improve the user experience and conversion rates.
4. Retention and engagement analysis
Retention and engagement analysis measures how frequently users return to your product or interact with key features over time. It helps you determine how "sticky" your product is and which features or functions keep users returning after their initial interaction. You can identify normal user behavior patterns and spot deviations that may indicate issues, like common drop-off points or a feature your users don't need.
Retention and engagement analysis also give you insights into customer satisfaction and loyalty. High retention indicates users find value in your product, while low retention may highlight issues that lead users to churn. Monitoring retention rates, stickiness, and cohort analysis can help you take data-driven actions to enhance user loyalty and reduce churn rates.
This type of analysis is especially valuable for subscription-based models, where understanding user retention is key to sustaining recurring revenue. Companies can track daily, weekly, or monthly active users to measure engagement and evaluate how updates or changes impact user behavior.
Key metrics for collecting behavioral data
User behavior metrics provide a holistic view of the customer experience and indicate opportunities for improvement. We're intentionally not including marketing metrics, which focus on the path to signing up and becoming a user.
- Feature usage: Knowing what features users want can help you decide what features to build, add, or remove.
- Element clicks and interactions: The more clicks an element (e.g., a CTA button) gets, the more helpful it is for users.
- Funnel drop-off during activation: Seeing a clear pattern of people abandoning your product can help you resolve any issues.
- Stickiness ratio: Stickiness gives insight into how many customers return to your product or feature.
- Sessions per user: The number of instances a user used your product indicates engagement.
- Adoption rate: The percentage of users who use a new feature you shipped.
- Activation rate: The rate at which your onboarding successfully gets new users to perform the first key actions in your product, such as setting up the first chart in a data visualization tool.
- Referral rate: Indicates how well your product or its features can motivate users to introduce it to others.
- Churn rate: The percentage of users you lost during a time period. Churn is common but can be minimized when managed right.
- MRR and ARR: The monthly and annual revenue your product generates.
- Retention rate: Measures how many users return to your platform—and, with the right behavioral data, also reveals why.
By considering two or three metrics or key performance indicators (KPIs), you can avoid the overwhelming task of tracking all these, enabling you to stay focused on the most important metrics. At Amplitude, we advise companies to define their North Star Metric (NSM). This metric defines your product's value proposition along with contributing inputs. It enables you to link your customers' problems to your company's revenue target, charting a course that benefits both. Explore the NSM framework in our North Star Playbook to find your North Star.
How to analyze user behavior
Analyzing user behavior can reveal insights for developing a better product. Ideas for what to analyze include:
- Behavioral cohorts involve segmenting users based on the actions taken in your product to facilitate comparisons and reveal trends.
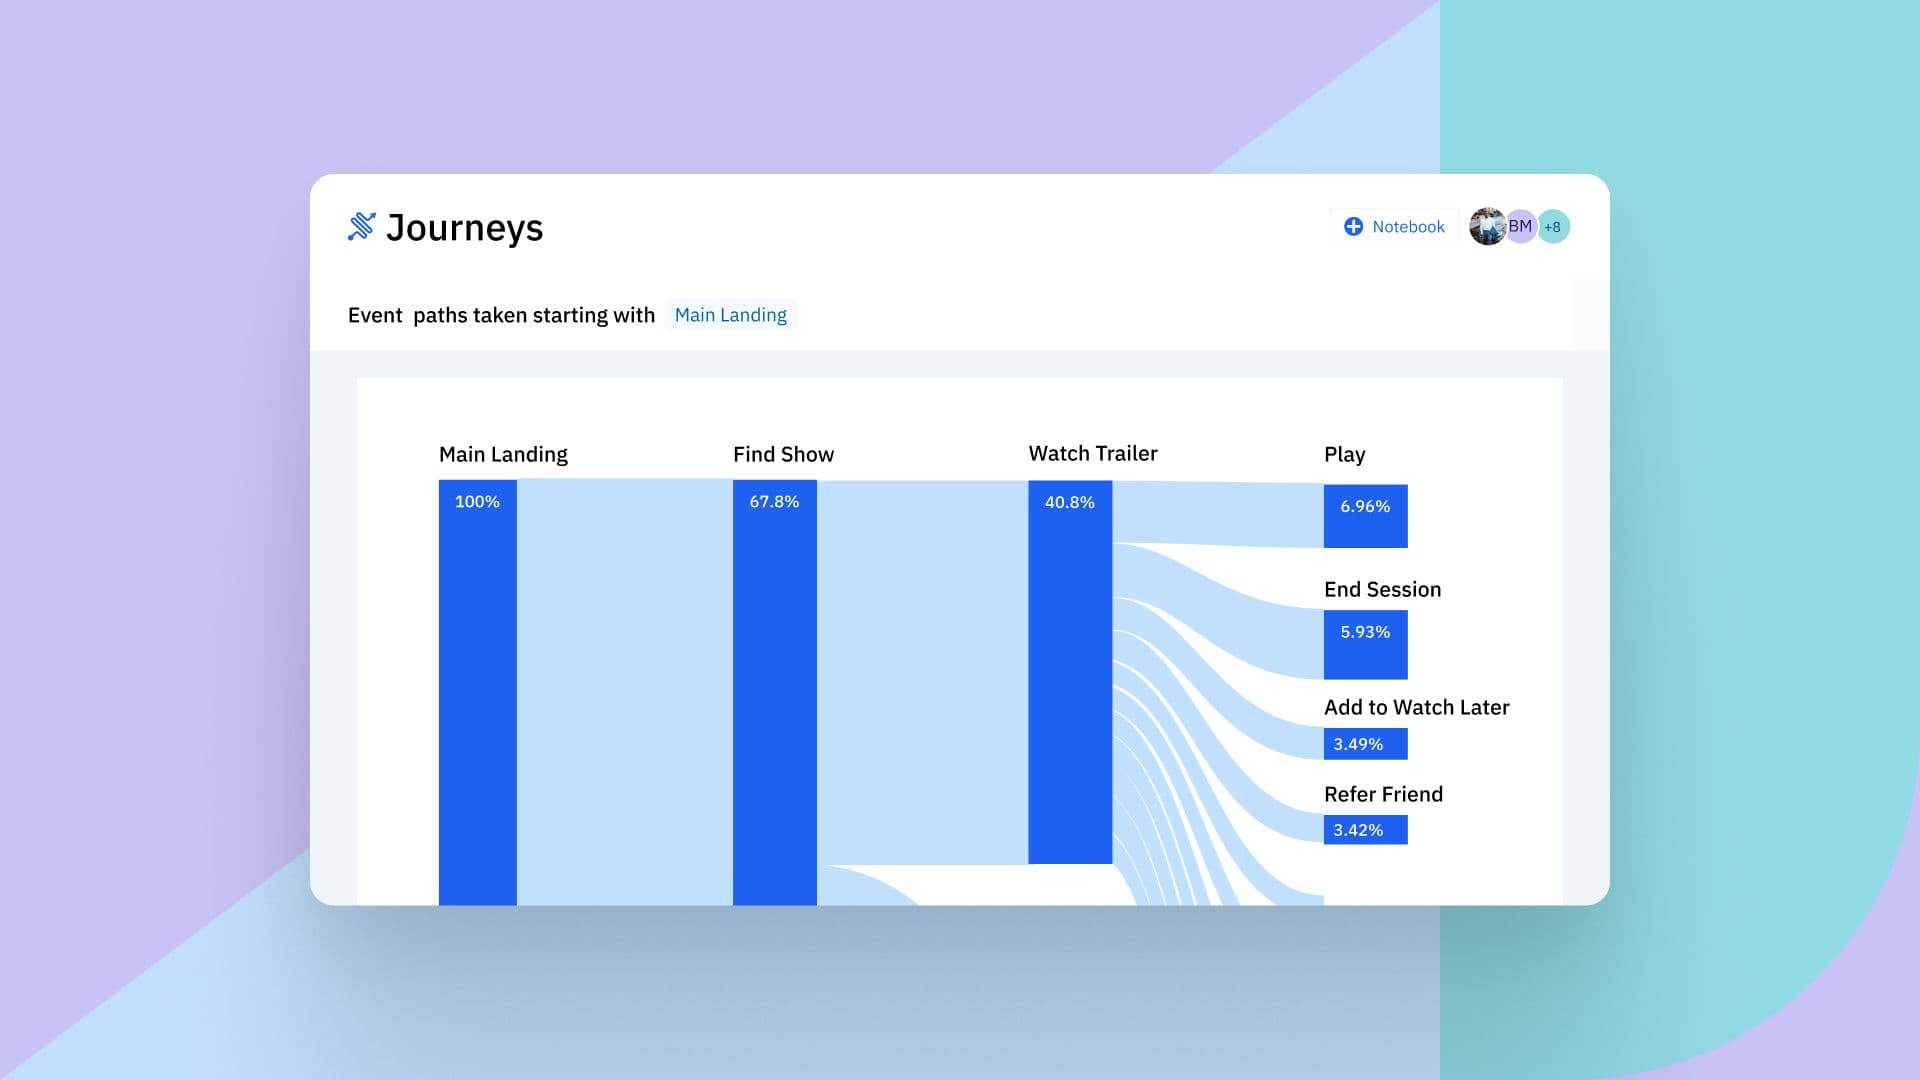
- Journeys show paths toward conversion or away from it. Knowing your audience's pain points and where they experience friction enables you to modify your product, messaging, or strategy. You can also correlate these patterns with behavioral cohorts for future analysis.
- Anomaly detection helps you uncover current and potential bugs in your product and pinpoint the causes.
- An engagement matrix provides insight into how well your users receive certain features, allowing you to highlight or improve them.
- Stickiness shows you what differentiates your most active users from average ones. The idea is to find what brings them back to your product again and again.
- Funnel A/B analysis rooted in event tracking enables you to analyze where users drop off from the flow so you can remove the hurdles.
- Conversion behaviors are actionable, especially when you find what preceded them. Knowing what customer behaviors lead to conversion can help determine which product development ideas are worth pursuing.
- Impact analysis involves tracking how the first use of a feature affects a user's overall journey so you can discern which features can lead to a better user experience.
- Revenue and LTV are the end game. But remember: it can't be a siloed effort––many teams collaborate to drive meaningful improvements. Improving these metrics also involves boosting customer satisfaction and addressing user needs, which involves working with customer success or sales enablement teams.
When analyzing user behavior, the focus is on actions taken within your product (starting a game, opening the app) or related user activity (push notifications, making a purchase). We call this wealth of information “events.”
10-step user behavior analysis process
The good news? You have full access to the show since the events are happening in your product. The key to leveraging them lies in knowing where to look. Follow our behavior analysis process to get started:
- Set business and analytics goals.
- Determine which events (user actions) support these goals.
- Set up a taxonomy of event categories and product properties.
- Identify users so you can attribute anonymous events to their rightful owners.
- Decide if you need cross-platform behavioral analytics.
- Identify app metrics that reflect your business goals and analytics.
- Track events crucial to onboarding, conversion, and retention.
- Set user and event properties to gain deeper insight into how your customers interact with your app.
- Examine whether user behavior events are being tracked correctly.
- Analyze user behavior.
When you're all set up, you can use user behavior insights to refine your product and customer experience.
Consider adopting a user behavior analytics tool to speed up and automate some of your UBA. Tools like Amplitude provide robust features and functions, such as built-in dashboards and automated tracking, as well as integrations with other platforms that make it easier to connect data across tools.
Examples of behavioral data analysis
Revenue is the goal of every business, but focusing on it singularly tends to yield short-term results. Actively leveraging user behavior analysis is key to a sustainable growth strategy. By doing so, you can identify areas for improvement, understand what users want at scale, define what core metrics can contribute to long-term growth, and gain a competitive advantage.
Under Armour Connected Fitness
Under Armour’s performance after leveraging user behavior analytics.
Under Armour wanted to know how its mobile experience helped users meet their fitness goals. However, its product analysts were subjected to a time-consuming process that required multiple iterations. By leveraging user behavior analytics, the team could quickly test assumptions, access data, and respond.
The company soon discovered through real-world user data that its race training plans needed to be higher on user engagement. So, to turn it around, it revamped the plans to introduce a wider variety of goals, from running basics to cardiovascular fitness. The changes delighted users, increasing conversions from free to paid and improving retention. The training plans feature tripled in use among paid users.
Babbel
Babbel is one of the most popular language-learning apps.
Language learning app Babbel created a Product Performance team to generate high-quality content faster. To do that, it looked at how its learning activities and product changes affected users.
Using Amplitude Templates, the team could immediately keep track of the impact of product updates using curated charts. This gave Babbel valuable data that shortened its release cycles and enabled it to create more content.
Common mistakes when analyzing user behavior
Avoid these common pitfalls when thinking through your behavioral analysis:
- Having a vanity metric, like increased revenue, doesn't provide a clear path forward.
- Launching too many new features simultaneously. This approach can muddle the whole picture or make the analysis ineffective. Essentially, you end up creating far too much work for yourself. Stick to launching just one or two new features at a time.
- Instrumenting events and properties improperly. When you instrument events, it's important to establish and enforce a set of data governance rules. In user behavior tracking, standard and accurate implementation is the cornerstone of success.
- Initially tracking too many events with your analytics tool. Focus only on key events from the onset to see which ones make more impact. Our recommendation is to instrument 20 to 30 events in the initial pass. If more events come up, you can always add them later on.
- Not involving every team in analytics usage. Product analytics is not just for product teams and data scientists. Data democratization removes bottlenecks that prevent other teams (UX/UI design, marketing, sales, support, leadership) from contributing to the user journey. Customer-facing teams, for instance, are often excluded.
- Analyzing data with auto-tracking or marketing tools. Studying surface-level interactions doesn't help in the long term. With user analytics tools, the focus is on your product experience and buyer's journey to promote sustainable growth. Learn more about the differences with our Google Analytics vs. Amplitude comparison.
- Not using best-in-breed tools across your tech stack. Technology evolves quickly. You don't want to end up with new tools that don't integrate with your old ones, creating data silos, which can happen a lot to legacy companies.
User behavior leads to better product initiatives
As you better understand user behavior, it becomes easier to determine user needs and develop features that address them. You can use your findings to build or improve products (and features) that satisfy current users and attract new ones at a growing rate.
To see what user behavior looks like in a product analytics tool, explore our test data in this free self-service demo.


Sam Edwards
Former Global Technology Partner Manager, Amplitude
Sam is a global technology partner manager at Amplitude and former solutions engineer and customer success manager. She specializes in helping businesses reach their revenue goals, scale for growth, and build the best product for their users.
More from Sam


